107ERCOT DART spreads
Los errores de previsión explican con fuerza la diferencia entre el precio de la electricidad del día anterior y el de tiempo real en Texas, y aun así no permiten predecirla: 110.208 horas, sin ventaja predictiva.
- Año
- 2026
- Estado
- Activo
- Con
- Travis Giggy
- Python
- pandas
- scikit-learn
- ERCOT
- bootstrap
- lookahead audit
Esta página solo está disponible en inglés.
The question
Can the spread between Texas's day-ahead and real-time power prices be predicted from public load, wind and solar forecasts, and does anyone actually make money trading it?
What I did
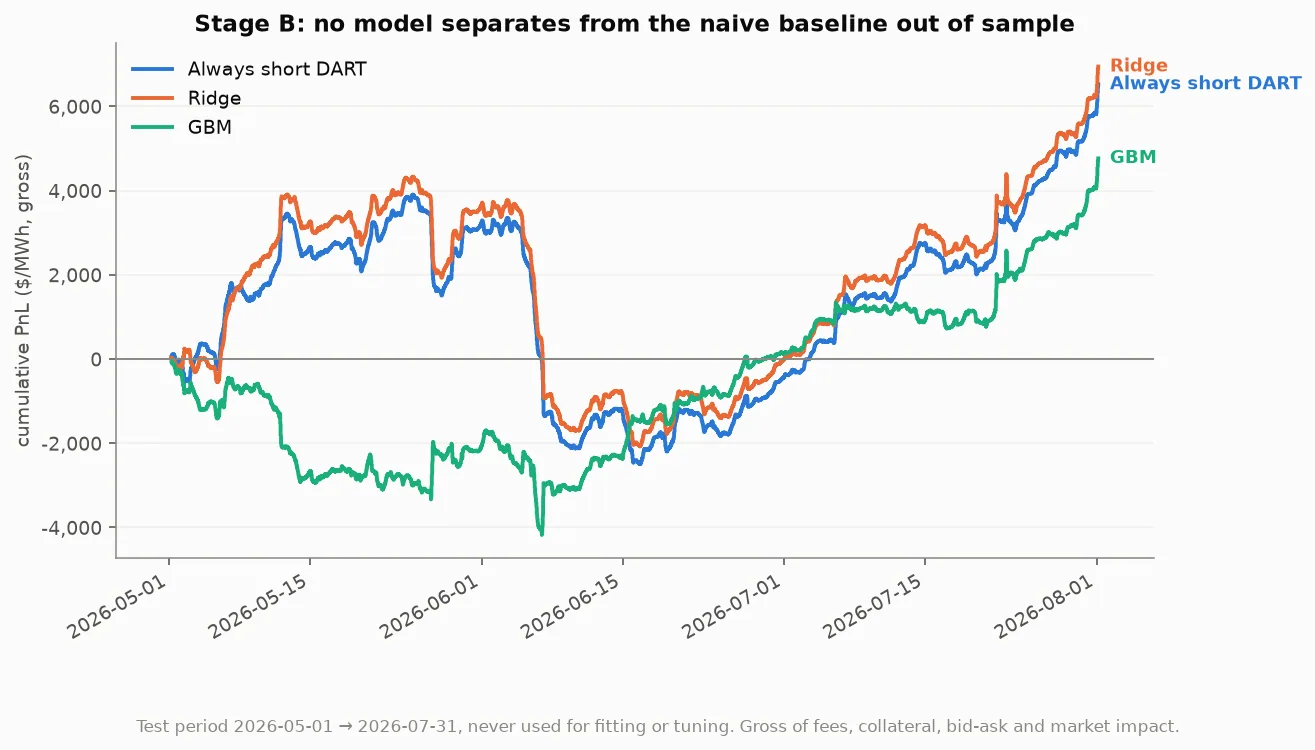
The hub study is Travis Giggy's; I reproduced it independently and ran follow-up studies. The panel holds 110,208 hourly observations across four hubs and 38 months, behind an audit proving every forecast was published before the auction closed. Models were fixed in advance and tested strictly forward in time against simple rules such as "always short the spread". A second study priced every cleared virtual position in ERCOT's public 60-day disclosures: 2,206,825 positions over 197 operating days.
What came out of it
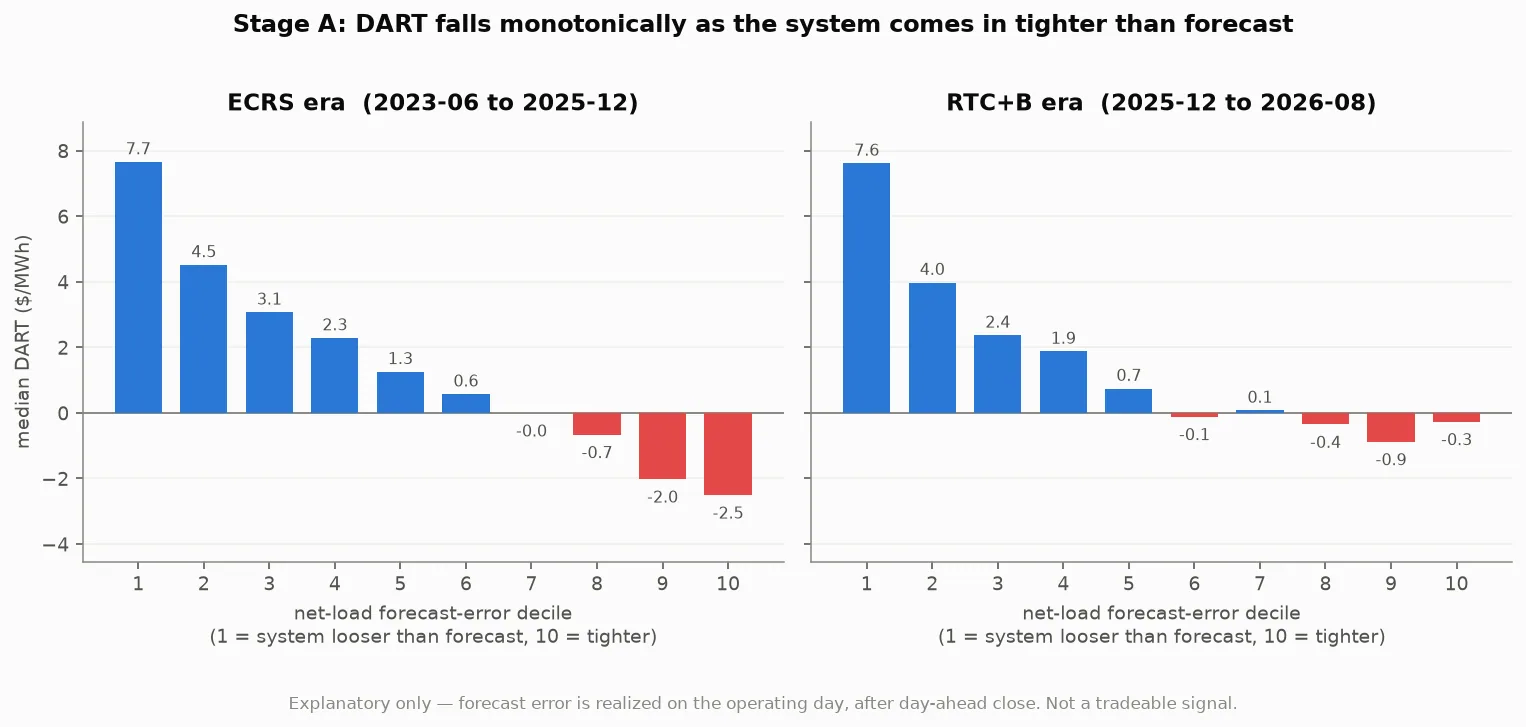
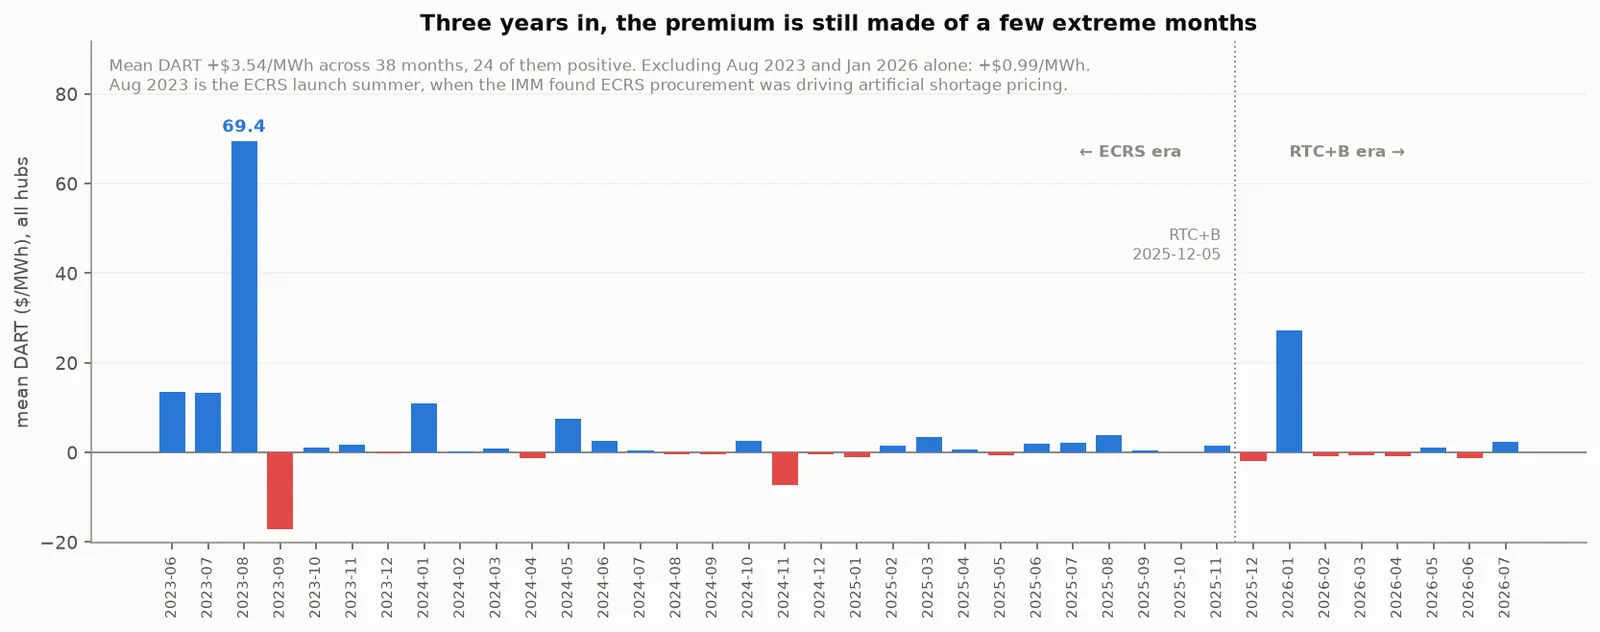
Forecast errors explain the spread strongly, with a rank correlation of −0.31 to −0.48 for net-load error, but they are only known after bids close. Nothing known at bid time beat "always short", and every confidence interval straddled zero. The baseline itself rests on a few extreme hours: drop the best 1% and its mean turns negative. The real traders in the census were no different: gross profit of $1.993 per MWh, with a day-clustered t-statistic of 1.14, not distinguishable from zero. In my follow-up, trading only the biggest hours lost to "always short" even with perfect foresight of their size.
What I'd try next
Stop testing whether the average spread is positive, which cannot be resolved at this concentration, and look at congestion and information close to physical assets, which none of these studies was built to test.