104Stock Patterns
Cruce dorado, RSI y colas gruesas: tres experimentos pequeños sobre cómo engaña un backtest, de 0 victorias en 25 a un campeón de +160% que perdió un 20% con datos nuevos.
- Año
- 2026
- Estado
- Activo
- Python
- pandas
- matplotlib
- backtesting
- train/test split
Esta página solo está disponible en inglés.
Three small experiments on the same question: do the patterns traders talk about hold up once you test them honestly?
1 · Golden Cross
The question. Buy when the 50-day average crosses above the 200-day: does it beat simply holding the stock?
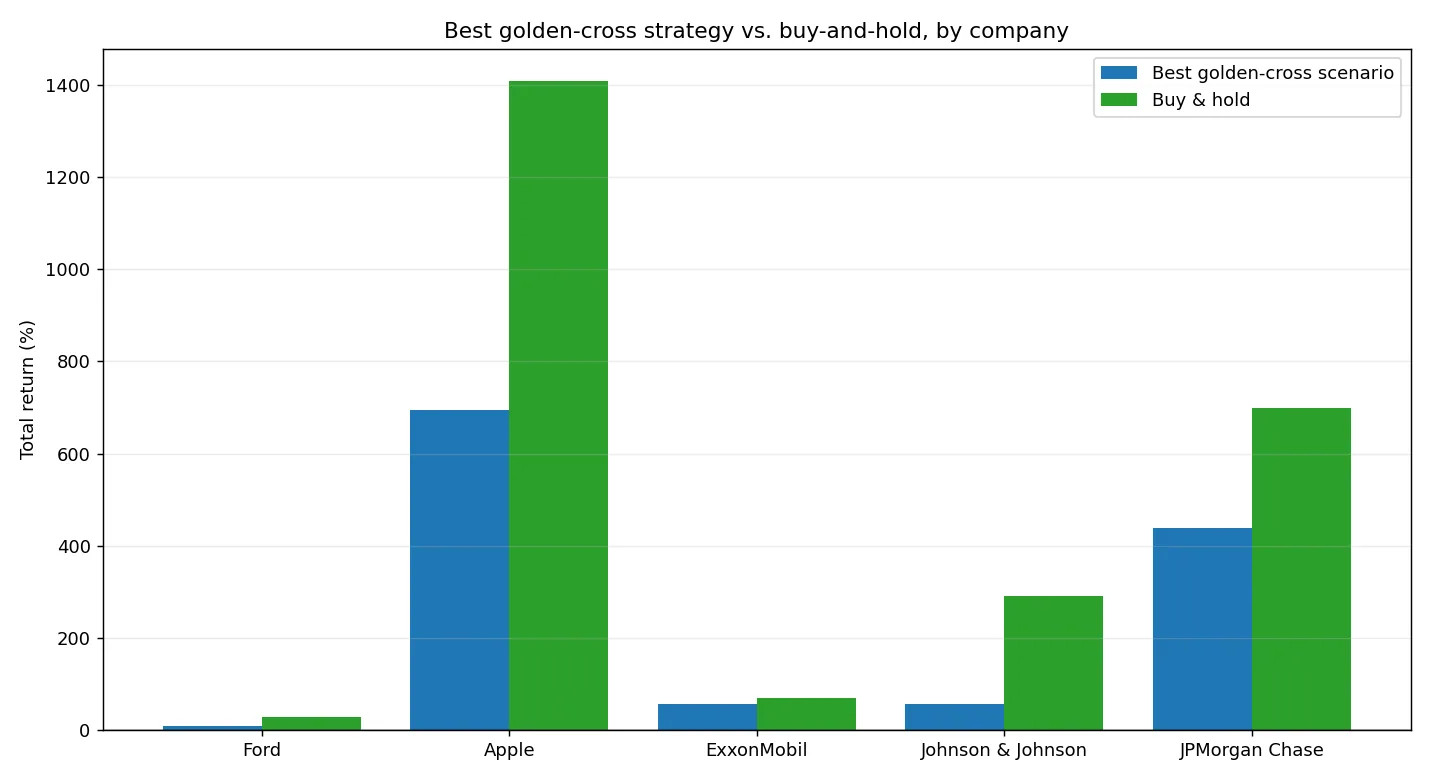
What I did. Ford, 15 years of daily closes. A cross counts only on the day it happens; every trade enters at the next day's close, so nothing peeks at the future. Five exits were tested: hold 7 days, hold 30 days, sell at the next death cross, an 8% trailing stop, and a +10% target with a 5% stop. Each was judged against buy-and-hold. Then the same pipeline ran on Apple, ExxonMobil, Johnson & Johnson and JPMorgan Chase.
What came out of it. On Ford, 12 golden crosses, and no exit beat buy-and-hold; the best, selling at the death cross, made +8.9% against buy-and-hold's +26.5%. Across all five companies the golden cross beat buy-and-hold in 0 of 5 scenarios, every time.
2 · The RSI Experiment
The question. Does a mean-reversion rule (buy oversold, sell overbought) do better, and does a tuned version survive data it wasn't tuned on?
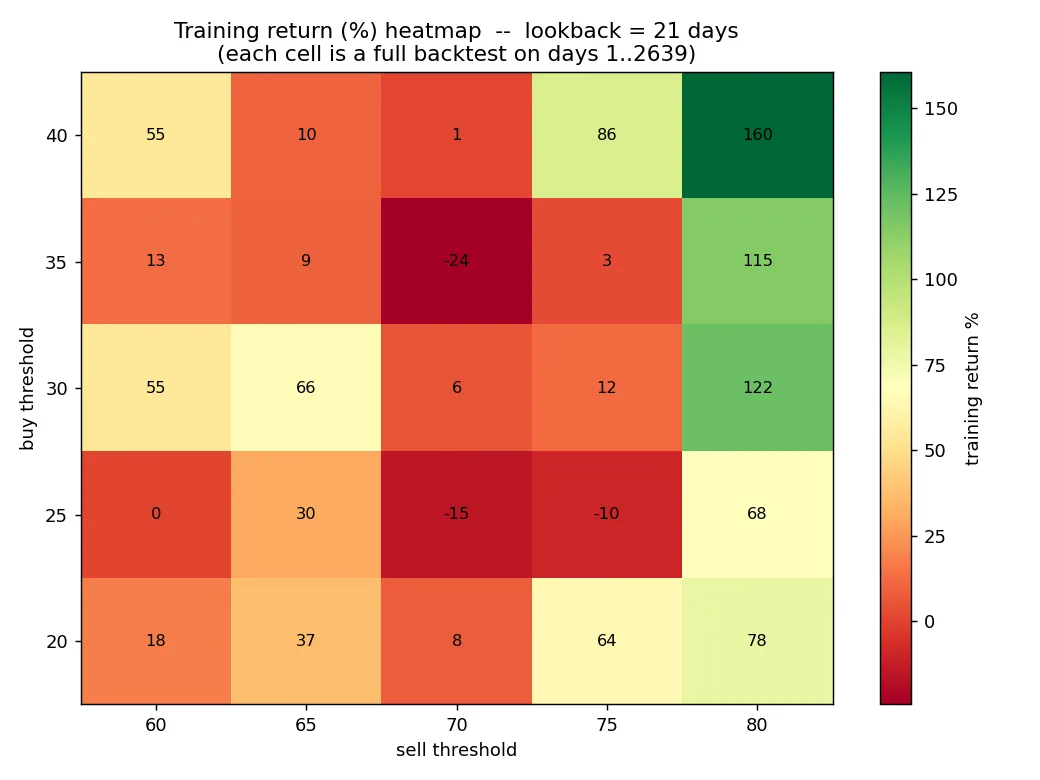
What I did. Ford again, 3,770 trading days. A conventional RSI rule first, then a grid of 125 parameter combinations searched on the first 70% of the data. The best one was locked in a file before the test years were ever loaded.
What came out of it. The conventional rule returned +66.0% against buy-and-hold's +9.0%, because Ford spent 15 years going sideways, which suits mean reversion. The tuned champion returned +160.5% in training with a 100% win rate, on exactly two trades. On the unseen test years it returned −20.2%, after one trade it held for 1,110 days. It technically "beat" buy-and-hold there (−20% against −42%), which one trade can't support. The note I wrote at the end: you can cheat without ever lying, and most beautiful backtests are exactly that.
3 · Proving it
The question. If price direction is close to random, is there any structure at all?
What I did. An exploratory script on Ford's daily returns: autocorrelation of returns against a random-noise control, a histogram against a normal curve, kurtosis, counts of 3- and 5-sigma days, and autocorrelation of the size of moves.
What came out of it. This one was exploratory: the script prints its checks to the console and keeps no saved results, so there are no numbers to report here.
What I'd try next
Run the RSI-versus-Golden-Cross contest on a strong trending stock such as Apple, where I'd expect the verdict to flip: the winner looks like a property of the stock's character, not of the indicator.